The Biodiversity Progress Index
Harnessing the power of people, AI and big data to quantify and track biodiversity worldwide
The challenge
The accelerating rate of biodiversity loss is one of the most critical threats facing all aspects of our society today. Addressing this threat is currently a top priority for policy makers, NGO’s, and most recently, as well as business leaders worldwide. However, commitments and initiatives by these different sectors will only be as effective as the information used to guide and evaluate them. Although we might have roadmaps and guidelines to achieve a nature-positive future, we are often at a loss when tasked with assessing the state of biodiversity, and even more so to use this information to help guide actions on the ground. How do we best measure biodiversity? What sources of data are most informative? Can we use the same metric across landscapes and continents? How much will this cost?

The technology
Artificial intelligence has been the present and future of our society for over 75 years. However, it is more recent advances in Machine Learning, and even more recently, Deep Learning, that have been driving the current explosion of AI applications worldwide, from facial recognition software to self-driving cars. A challenge as big as how to measure life is best met by leveraging these technological advances to develop an approach for quantifying biodiversity that is robust, scalable, and computationally efficient. Dr. Carla Gomes and her research group at the Institute for Computational Sustainability at Cornell University have developed a computational model that leverages the latest advancements in AI to quantify biodiversity in a framework that is reliable and scalable.
Examples of environmental variables at plot and landscape level that have been identified as drivers of biodiversity.

The status of biodiversity and changes in biodiversity over time can be directly linked to changes in the availability and connectivity of different habitat types.


The data
The Global Biodiversity Information Facility (GBIF) houses the world’s most comprehensive dataset on biodiversity. Approximately half of the records in GBIF come from one single source – eBird. To date, eBird boasts over 1.8 Billion observations on birds submitted by over 1M citizen scientists worldwide, and growing at about 40% per year. These data are not just impressive in scale and volume, but also in the highly curated nature that they are collected and stored. The eBird data base boasts thousands of built-in filters, and a network of thousands of reviewers worldwide, that allows scientists and decision-makers to use eBird as a source of information for applications that range from population assessments for listing under the Endangered Species Act, to informing regulatory processes for the sighting of wind-energy developments. The built-in processes for quality-control in eBird allows for the community that contributes data to be highly diverse, ranging from community members and local tour guides, to trained survey technicians and professional birdwatchers. This results in an inclusive process for quantifying biodiversity that is not just accurate and scalable, but also cost-effective.
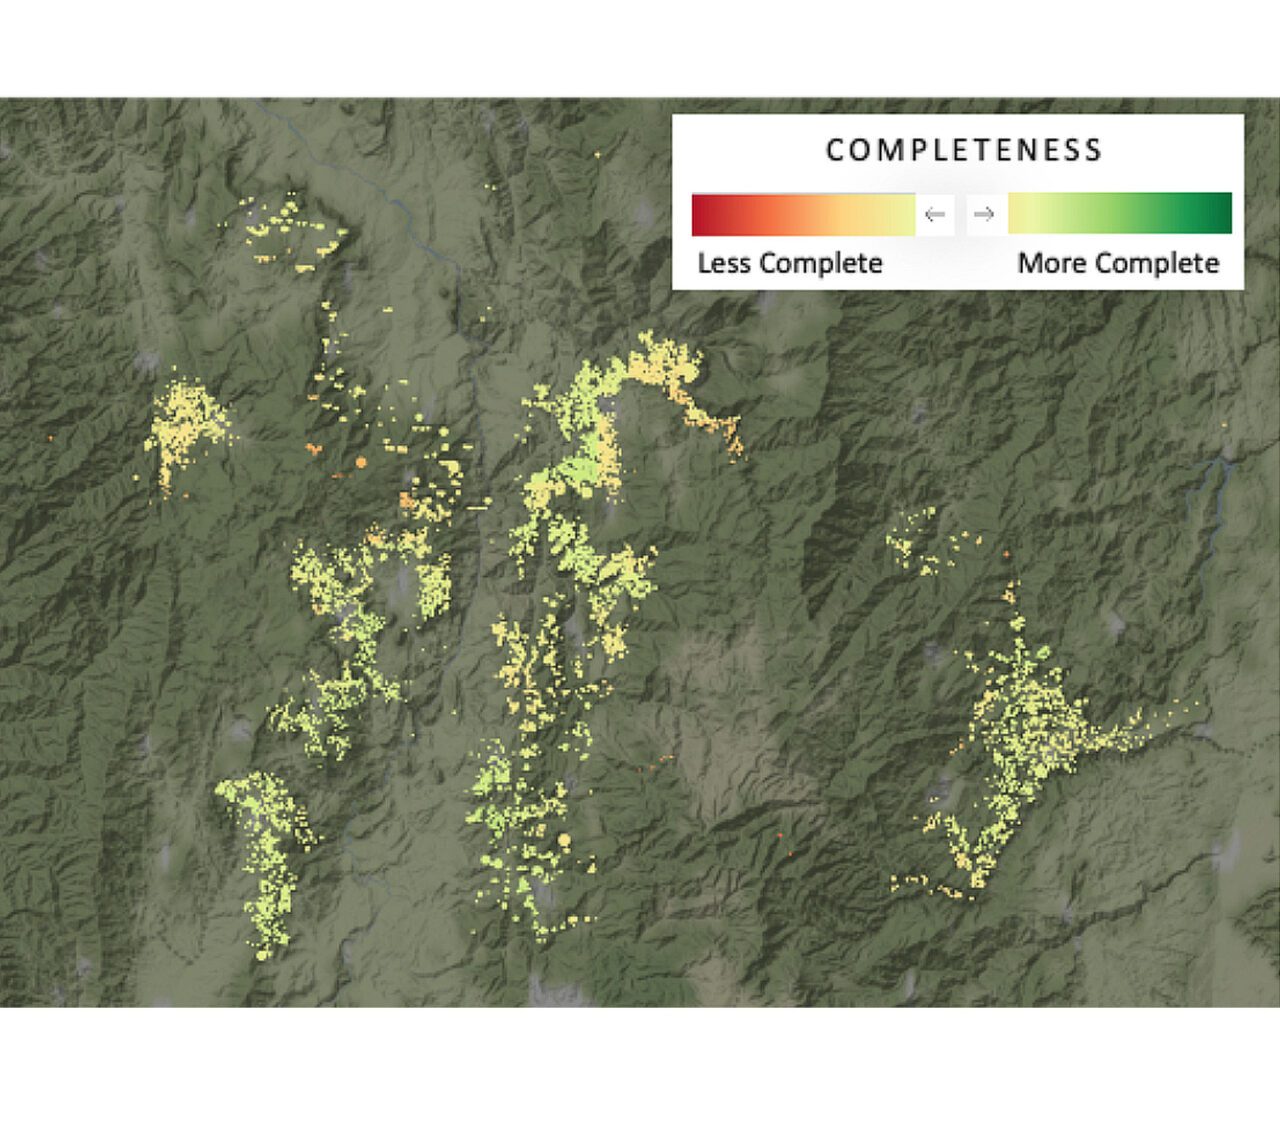
How is biodiversity measured? The Biodiversity Progress Index
In 2019, Nespresso’s AAA Sustainable Quality Program, the Cornell Lab of Ornithology, and the Institute for Computational Sustainability partnered to jointly develop the Biodiversity Progress Index (BPI), with the support of ECOM Sustainable Management Services and the INCAE business school. The BPI leverages cutting-edge artificial intelligence technologies for big data jointly developed by the Cornell Lab of Ornithology and the Institute for Computational Sustainability (Davis et al. 2023). The BPI brings together high-quality field data from eBird and >100 sets of high-resolution remote sensing data on environmental conditions to quantify biodiversity at high spatial (e.g., 3km) and temporal resolutions (e.g., monthly).
The BPI uses two sets of metrics to assess the status of biodiversity:
1. Community Completeness: This metric reflects the status of biodiversity. It measures how much biodiversity is in a given location relative to what should be there, given current environmental conditions. The values for the metric range between 0 and 1, where a value of 1 indicates a “complete” community with 100% of species present that should be present, and a value less than 1 indicates that some species are missing. Community completeness is the benchmark metric for comparison across habitats, countries, and regions.
2.Performance: This metric reflects the relative contribution to biodiversity relative to the landscape. It measures the status of biodiversity of a given location, relative to the status of biodiversity of the surrounding landscape. It is measured by comparing the monthly values of community completeness of a farm, relative to the average community completeness of the surrounding landscape. The values for the metric range from -100 to 100, where a value of 100 indicates that a farm has higher completeness than the surrounding landscape year-round, and a value of -100 indicates that a farm has lower completeness.
How can I use the BPI?
Assess the state of biodiversity and track progress over time: The BPI provides a cost-effective, robust, and transparent way to measure and communicate on the state of biodiversity from the plot to landscape, and even national levels. This means that a single, standardized approach can be used to quantify and communicate the contributions to biodiversity across disparate supply chains. The BPI metrics can be updated frequently (e.g., every 1-3 years) to measure changes in biodiversity needed to assess and guide regenerative practices, at both the plot and landscape levels. Regular evaluations can show progress toward achieving biodiversity commitments and help quantify the return on sustainability investments.
Drivers of Biodiversity: The BPI uses >100 different remote-sensed environmental variables to capture information about habitat quality and relates these to biodiversity. These variables describe environmental conditions and habitat features such as elevation, forest cover, and urbanization impacts. For variables related to habitat type, we summarize the proportion and connectivity of each habitat type at a 3 x 3km resolution. These variables can be related to the two biodiversity metrics of completeness and performance to understand the drivers of biodiversity from the plot to landscape levels. For example, a loss of biodiversity over time might be linked to changes in tree cover or connectivity. This information can be used to inform on-the-ground actions and investments that benefit biodiversity while promoting more sustainable livelihoods and supply chains.
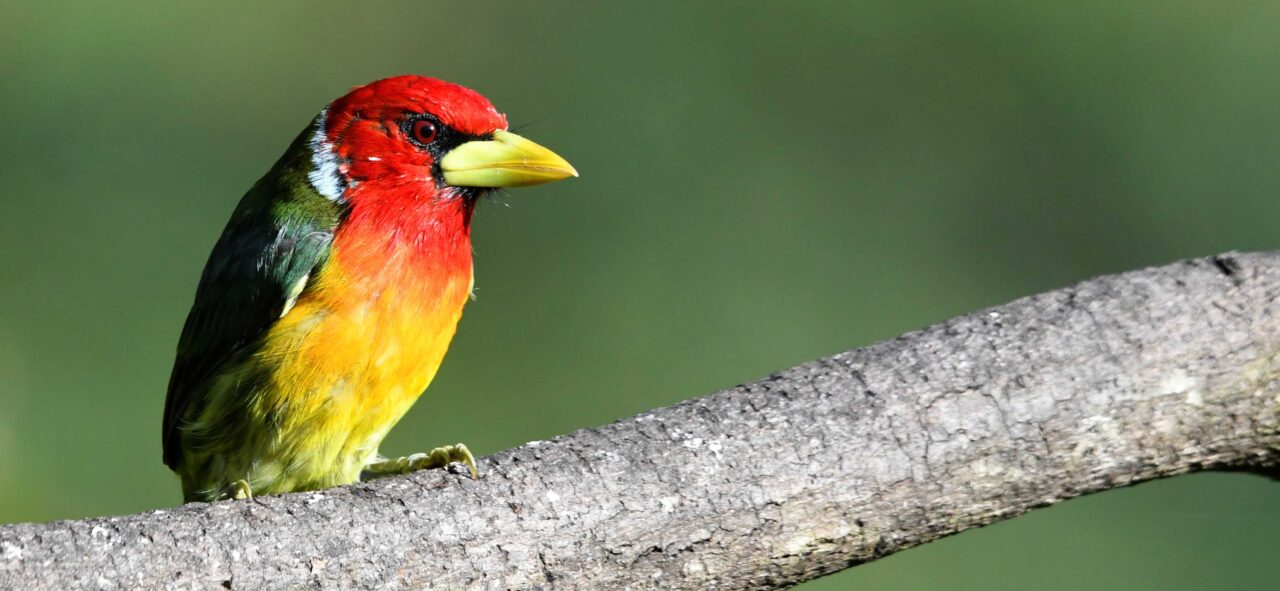
Why birds?

Birds as indicators of biodiversity: The BPI leverages the utility of using birds as indicators of biodiversity and ecosystem health. Birds use a wide range of natural and human-managed environments, and many species respond quickly to changes in their surroundings, making them highly reliable and scalable indicators of ecosystem health. Birds are also charismatic and easily observed by farmers, children, and community members, sparking curiosity and engagement in nature. Because of these factors, birds are the most well-studied taxonomic group on the planet and provide a cost-effective and reliable approach to understand the status of other species groups with limited data available like insects, amphibians, reptiles, and mammals.
We can measure community completeness (shown here) at high spatial (e.g., 3km) and temporal resolutions (e.g., monthly), for species-rich countries such as Costa Rica (e.g., 875 species).